Here’s what changed in September, why, and what the portfolio paid.
The portfolio is built to pay me every month. It has two parts: listed investment companies that own Australian shares and pay fully franked dividends, and listed funds that lend money and pass on the interest. I don’t use dividend reinvestment plans. I reinvest by hand, mostly when prices dip. Cash I haven’t invested sits outside the portfolio and isn’t counted here.
Every yield and income figure includes franking credits. At my tax rate they come back to me as a refund, so they’re part of what the portfolio pays. Holdings are shown at what I paid for them, not at market prices, so every yield is a yield on cost.
September at a glance
| Start of September | End of September | Change | |
|---|---|---|---|
| Holdings | 11 | 10 | −1 |
| Cost | $602,094 | $646,915 | +$44,821 |
| Monthly income, gross | $4,128 | $4,479 | +$351 |
| Yield on cost | 8.23% | 8.31% | +0.08 pts |
The cost of the portfolio went up by $44,821: I bought $54,821 worth of GCI, KKC, TCF and WMX, and sold ECRD, which had cost me $10,000. Monthly income rose by $351. The yield on cost rose a little, mainly because the TCF and KKC units I bought pay well above the portfolio’s average and ECRD paid below it.
What changed and why
| Holding | Units at start | Units at end | Change | Cost change |
|---|---|---|---|---|
| GCI | 55,000 | 72,000 | +17,000 | +$34,468 |
| KKC | 17,950 | 22,300 | +4,350 | +$9,156 |
| TCF | 5,934 | 7,500 | +1,566 | +$7,046 |
| WMX | 13,410 | 16,000 | +2,590 | +$4,151 |
| ECRD | 403 | 0 | Sold | −$10,000 |
| WHI | 131,270 | 131,270 | No change | |
| MXT | 50,000 | 50,000 | No change | |
| PL8 | 30,000 | 30,000 | No change | |
| QRI | 21,000 | 21,000 | No change | |
| MA1 | 12,000 | 12,000 | No change | |
| LEND | 1,000 | 1,000 | No change | |
| Total | +$44,821 |
- GCI, +17,000 units. Built in stages through the month. It holds mostly residential mortgage securities that pay floating rates, so its income moves with interest rates. I’d rather add in steps than all at once.
- KKC, +4,350 units. Its discount to net assets went past 10% during the month. That’s the level where I buy more, so I did.
- TCF, +1,566 units. The price fell to more than 20% below its net assets, so I bought more at about $4.50. That takes it from 5.7% to 6.4% of the portfolio. Its size stays on my watch list because the loan book is concentrated.
- WMX, +2,590 shares. I added on market at about $1.60. The company is lifting its dividend each month through December, and counting franking it yields about 6.6% on what I’ve paid.
- ECRD, sold. I flagged it in August. It borrows to boost its income and charges the highest fee of anything I looked at, yet it still paid less than my other lending holdings, so I sold all 403 units.
- WHI, unchanged. My main share holding, and its size is deliberate: it anchors the share side of the portfolio. It went from 29% to 27% of the portfolio only because I added to other holdings.
- MXT, unchanged. Its June quarterly report showed loans in enforcement rising from 1.3% to 3.8% of the book over six months, although every loan is still valued at 97.5 cents or more and there have been no realised losses. I’m holding rather than adding until the September quarter’s report.
- PL8, QRI, MA1 and LEND, unchanged. LEND’s monthly distribution eased from 15c to 14.5c in August.
Where the portfolio stands
| Ticker | Name | Units | Avg cost | Cost | Weight | Monthly income | Yield on cost |
|---|---|---|---|---|---|---|---|
| WHI | Whitefield Income | 131,270 | $1.3279 | $174,313 | 26.95% | $1,093 | 7.53% |
| GCI | Gryphon Capital Income | 72,000 | $2.0570 | $148,104 | 22.89% | $984 | 7.97% |
| MXT | Metrics Master Income | 50,000 | $1.9182 | $95,910 | 14.83% | $730 | 9.13% |
| KKC | KKR Credit Income | 22,300 | $2.1205 | $47,287 | 7.31% | $373 | 9.46% |
| PL8 | Plato Income Maximiser | 30,000 | $1.3990 | $41,970 | 6.49% | $236 | 6.74% |
| TCF | 360 Capital Mortgage REIT | 7,500 | $5.5220 | $41,415 | 6.40% | $375 | 10.87% |
| QRI | Qualitas RE Income | 21,000 | $1.5454 | $32,453 | 5.02% | $224 | 8.28% |
| WMX | WAM Income Maximiser | 16,000 | $1.6794 | $26,870 | 4.15% | $149 | 6.64% |
| MA1 | MA Credit Income | 12,000 | $1.9828 | $23,794 | 3.68% | $171 | 8.63% |
| LEND | VanEck Listed Private Credit | 1,000 | $14.7982 | $14,798 | 2.29% | $145 | 11.76% |
| Total | $646,915 | 100% | $4,479 | 8.31% |
Holdings by cost
WHI and GCI together are just under half the portfolio (49.8%), and that’s by design. MXT comes next at about 15%. The other seven sit between 2% and 7.5% each.
| Part | Holdings | Cost | Weight | Monthly income | Share of income | Yield on cost |
|---|---|---|---|---|---|---|
| Shares | WHI, PL8, WMX | $243,154 | 37.59% | $1,478 | 33% | 7.29% |
| Lending | GCI, MXT, KKC, TCF, QRI, MA1, LEND | $403,761 | 62.41% | $3,001 | 67% | 8.92% |
Lending is 62% of the money and 67% of the income. The share side pays less, but it’s where the franking comes from and where I expect most of the capital growth over time.
Where the income comes from
Monthly income by holding
The hatched part of each bar is franking credit. It’s real money to me, but it comes back once a year as a tax refund rather than with the dividend. In cash, the portfolio pays about $4,036 a month, with roughly $5.3k a year of franking on top.
What the money is secured against
This splits the portfolio by what the money is secured against. About 43% is lending tied to Australian property: residential mortgages through GCI, and commercial property loans through MXT, TCF and QRI. The borrowers are different, households on one side and developers and property owners on the other, but they share the same housing market and the same interest rates. It’s the number I watch most closely. The split is my own estimate: MXT’s property share comes from its June report, and I’ve counted MA1 as corporate lending.
How the income arrives
A typical month
| When it lands | From | Cash | Franking | Gross |
|---|---|---|---|---|
| Around the 8th | GCI, MXT, TCF | $2,089 | $2,089 | |
| Mid-month | QRI, MA1, LEND | $540 | $540 | |
| Around the 23rd | KKC | $373 | $373 | |
| Month-end | WHI, PL8, WMX | $1,034 | $443 | $1,478 |
| Total | $4,036 | $443 | $4,479 |
Almost half the income lands around the 8th, when GCI, MXT and TCF pay. QRI, MA1 and LEND pay mid-month, KKC around the 23rd, and the franked dividends arrive at month-end. Most of the lending trusts go ex-distribution at the end of the month, so what they pay the next month is for the month before.
What September paid
| Holding | Cash | Franking | Gross |
|---|---|---|---|
| WHI | $1,159.11 | $496.76 | $1,655.87 |
| GCI | $751.30 | $751.30 | |
| MXT | $730.00 | $730.00 | |
| KKC | $299.97 | $299.97 | |
| TCF | $296.70 | $296.70 | |
| PL8 | $165.00 | $70.71 | $235.71 |
| QRI | $224.03 | $224.03 | |
| MA1 | $171.04 | $171.04 | |
| LEND | $145.00 | $145.00 | |
| WMX | $87.16 | $37.36 | $124.52 |
| Total | $4,029.31 | $604.83 | $4,634.14 |
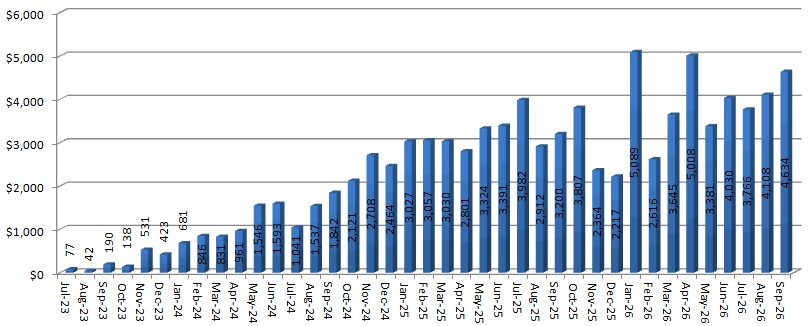
September paid $4,634.14 gross: $4,029.31 in cash and $604.83 in franking credits. That’s above the $4,479 run rate only because WHI paid its half-yearly top-up, about $563 of its $1,655.87. Without it, September would have come in lower: GCI, KKC, TCF and WMX paid on smaller positions than I hold now, because I added to them after their record dates. On current holdings those four pay more from October.
Conclusion
September was mostly buying: GCI in steps, KKC and TCF once their discounts to net assets opened up, and a small WMX top-up. I sold ECRD. The portfolio ends the month at a cost of $646,915, paying about $4,479 a month including franking, or roughly $53.7k a year before WHI’s top-ups.
For October I’m watching four things: MXT’s September quarterly, and whether any loan is marked below 97.5 cents; Whitefield’s shareholder meeting on 16 October, which includes approval to issue up to 120 million new shares; LEND’s next distribution after August’s decline; and how much of GCI sits in senior tranches, which I want to confirm before adding more.
Notes. Holdings are shown at what I paid for them (average cost), not at market value, and yields are yields on cost. The start of September is the position in my August report, on 2 September. Income figures are monthly run rates on current holdings at each holding’s latest paid rate, with franking at 30%. Figures are rounded, so some columns don’t add exactly.
Monthly dividends recieved since July 2023