
This is just an opinion, of course.
Three new risk signals, none individually a sell trigger, but together they argue against further buying.
The main one: enforcement has tripled in six months
| Dec 25 | Mar 26 | Jun 26 | |
|---|---|---|---|
| Loans under enforcement | 3 | 4 | 6 |
| Enforcement, % of AUM | 1.3% | 2.5% | 3.8% |
| Total watchlist, % of AUM | 1.4% | 2.6% | 3.9% |
| Realised losses | 0 | 0 | 0 |
Six loans representing 3.8% of assets were under enforcement at 30 June 2026, against three loans at 1.3% six months earlier.
The composition change matters more than the level. Watchlist loans not yet in enforcement now sit at one loan and effectively 0% of assets. So six of the seven problem loans have already moved to enforcement. Compare March 2024, when fifteen loans at 6.0% were on the watchlist with only one in enforcement. Problems used to sit in observation. Now they go straight to enforcement.
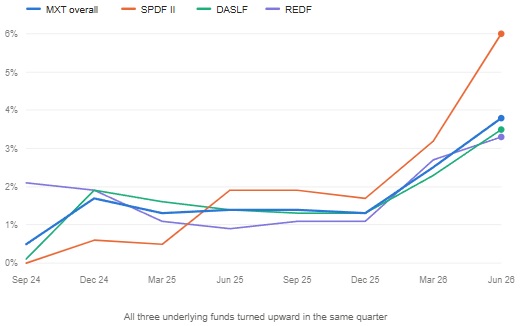
All three underlying funds turned at the same time in March 2026. Secured Private Debt Fund II is the worst at 6.0%, with performing loans down to 94% of assets. That fund lends to sub-investment-grade mid-market corporates, so it’s where I’d expect stress to appear first.
Second: the rating crossed a threshold
MXT’s weighted average credit rating had been BBB- in every quarter from September 2021 through December 2025. It moved to BB+ in March 2026 and stayed there in June. That’s a shift from the lowest investment-grade notch to the highest sub-investment-grade one. The real estate debt fund made the same move in the same quarter.
| Credit band | Jun 25 | Jun 26 |
|---|---|---|
| Investment grade | 53% | 43% |
| BB | 36% | 45% |
| Below B and unrated | 0% | 3% |
The report describes the split as consistent with the historical range. Checking that against the full table, 43% is the lowest investment-grade share in the entire twenty-quarter series. It’s technically inside the range because it sets the bottom of it. I’d treat that phrasing as management framing rather than a neutral description.
Third: enforcement loans are still carried near par
Every loan in the MXT portfolio is valued at 97.5 cents in the dollar or above, with none below 95c. That includes the six loans in enforcement. The manager is signaling it expects close to full recovery on all of them.
That may well be right. Metrics has recorded one realised loss in five years, and 97% of the book is senior ranking. But it’s the single place where an unpleasant surprise would come from, because the marks have no room to be wrong in your favour. Worth noting that at the sub-fund level, Secured Private Debt Fund II does carry 1% of its book below 85 cents, a mark that doesn’t survive aggregation up to MXT.
Two things you won’t see in the headline numbers
Payment-in-kind loans, disclosed for the first time from the December 2025 quarter. These let a borrower roll interest into the loan balance instead of paying cash. MXT is at 1.7% of assets across six loans, which is small. Secured Private Debt Fund II is at 5.4%. PIK income counts toward reported returns without cash arriving, so it flatters the numbers slightly. The fact that Metrics started disclosing this line at all is the more interesting signal.
Loan-to-value ratios on commercial property. MXT’s average CRE loan-to-value is 69%, up from 63% two years ago. The real estate debt fund is at 72%, the highest in its reported history. Thinner equity cushions underneath the loans, at the same time enforcement is rising.
What this means across a whole portfolio, not just MXT
Real estate development plus REIT lending is 58% of MXT’s book, up from 42% in 2021. Applied to a holding of roughly $96,000:
| Source | Property-linked debt |
|---|---|
| MXT, 58% of $95,910 | $55,628 |
| TCF | $34,369 |
| QRI | $32,453 |
| Total | $122,450, or 20.3% |
That’s about a fifth of the portfolio in Australian commercial property and development debt, spread across three managers lending into the same cycle. TCF and QRI look diversified against MXT on a fund-name basis. On an underlying-exposure basis they are much less so. Adding residential mortgage exposure would raise the property-linked share considerably further, though prime residential mortgages carry a genuinely different risk profile to development finance, so I wouldn’t pool them.
What isn’t deteriorating
Returns beat target. The June quarter was 2.16% net and twelve months came in at 8.21%, against a target of the cash rate plus 3.25%, delivering cash rate plus 4.30%. Diversification is good, with 354 loans, a largest single exposure of 2.5% and top ten at 17.3%. Fees are lower than at listing. Senior ranking loans are 97% of the book. And realised losses remain zero.
My Take
Hold, don’t add. I’ll wait a quarter or two. If enforcement resolves at or near full recovery, this was ordinary cycle noise in a tightening environment and you buy with better information. If loss provisions appear or marks drop below 95 cents, price may fall further.
The specific thing for me to watch in the September 2026 report is whether any loan moves below 97.5 cents. That’s the number that tells me whether the near-par valuations on enforcement loans were realistic.
Two issues. The June figures are unaudited and preliminary, and the report says they may differ materially from the final audited accounts. And this is one quarterly report, not the trend across Metrics’ broader $40 billion book or what comparable managers are reporting for the same quarter, so it can’t tell me whether this is MXT-specific or the whole Australian private credit market turning at once. That distinction would change the conclusion, and it’s the thing to want to know next.